
Starting a business is exciting. But the reality is harsh. Studies have consistently shown that most startups don’t make it.
From the very first year to a decade down the line, failure rates climb steadily, and the reasons behind it are more varied than most founders realize.
If you’re planning on starting a startup or are already managing one, it’s important to understand why startups fail, which industries are riskier, and how survival changes over time.
That way, you’ll make smarter decisions and avoid common pitfalls before they sink your venture.
In this blog, we’ll discuss the following topics:
- Why startups fail
- How many startups fail in the first year?
- Startup failure rate by industry
- Startup failure rate by year
Key Startup Failure Stats
- 34% of startups fail due to lack of product-market fit
- 22% fail because of marketing problems
- 18% fail due to team issues
- 16% fail from financial problems
- 20% of startups fail within the first year
- 30% fail by the end of the second year
- 50% fail by the 5th year
- 70% fail by the 10th year
- Startup failure rates vary by industry: 63% in information, 55% in transportation and utilities, 53% in construction and retail, 42% in finance, insurance, and real estate
Why startups fail
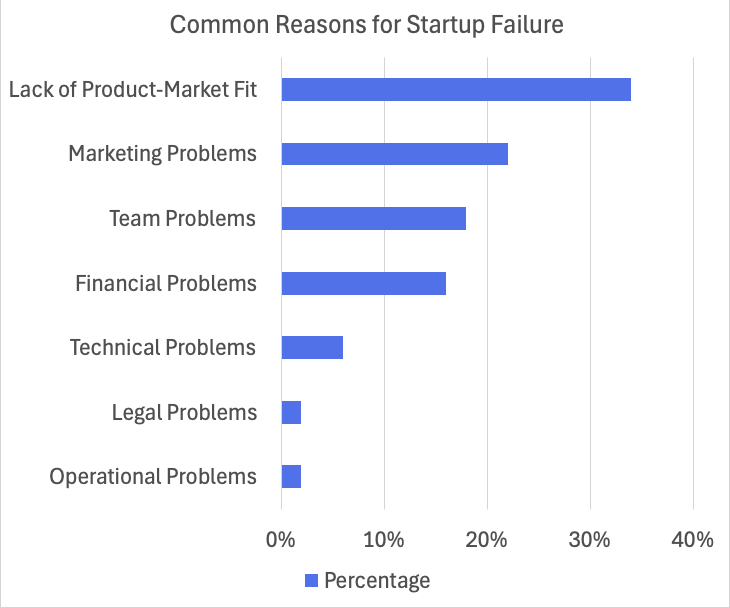
Roughly 34% of startup failures trace back to lack of product-market fit. That’s the single biggest reason companies shut down.
Many teams build something impressive but misread what customers actually want or are willing to pay for.
Marketing problems come next at 22%, highlighting how often startups struggle to reach the right people or clearly explain why their product matters.
Team issues also play a major role, contributing to 18% of failures, usually when misalignment or internal friction slows progress.
Close behind are financial problems at 16%. This mostly happens when poor cash flow, rising costs, or failed funding plans leave little room to recover.
Other factors show up far less frequently but still appear in the data. Technical problems account for 6% of failures, while operational and legal issues each represent about 2%.
These causes are rarely fatal on their own, but they can magnify existing weaknesses.
We’ve broken down these startup failure reasons in the bar graph below.
How many startups fail in the first year?
Data from the U.S. Bureau of Labor Statistics’ Business Employment Dynamics report shows that roughly 20% of new businesses shut down within their first year. That figure is often cited as a benchmark, but there’s a need for context.
Many of the businesses included in that number are traditional local companies, not venture-backed or innovation-driven startups.
If you’re building something new, untested, or trying to disrupt an existing market, the risk profile looks very different. Startups operate with far more uncertainty, from unclear demand to unproven business models.
So while the 20% figure offers a general snapshot of early business survival, it likely understates the real challenges faced by true startups in their first year.
Startup failure rate by industry
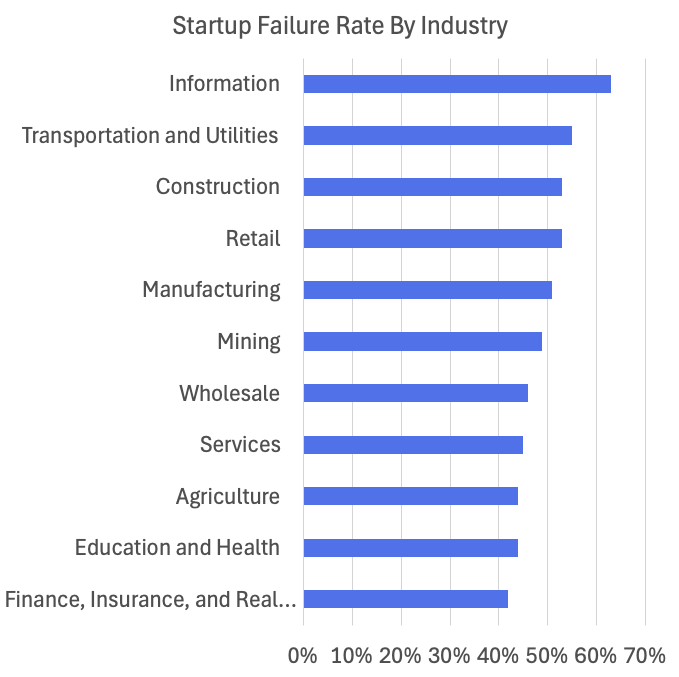
Startup failure rates vary widely depending on the industry. And the differences are more pronounced than many founders expect.
On the lower end, finance, insurance, and real estate startups see a failure rate of about 42%, while education, health, and agriculture businesses are close behind at 44%.
Service-based startups, like web design for example, land around 45%, followed by wholesale at 46%. These industries tend to benefit from steadier demand, but they’re still far from low-risk, especially for new entrants without strong differentiation.
The numbers climb sharply in more complex or capital-heavy sectors. Mining startups face a failure rate of roughly 49%, manufacturing jumps to 51%, and both construction and retail sit at 53%.
Transportation and utilities push the risk even higher at 55%. Information-based startups top the list, with about 63% failing.
The infographic below breaks down these industry-level differences. That way, it’s easier to see where startup risk rises fastest and where the margin for error is thinnest.
Startup failure rate by year
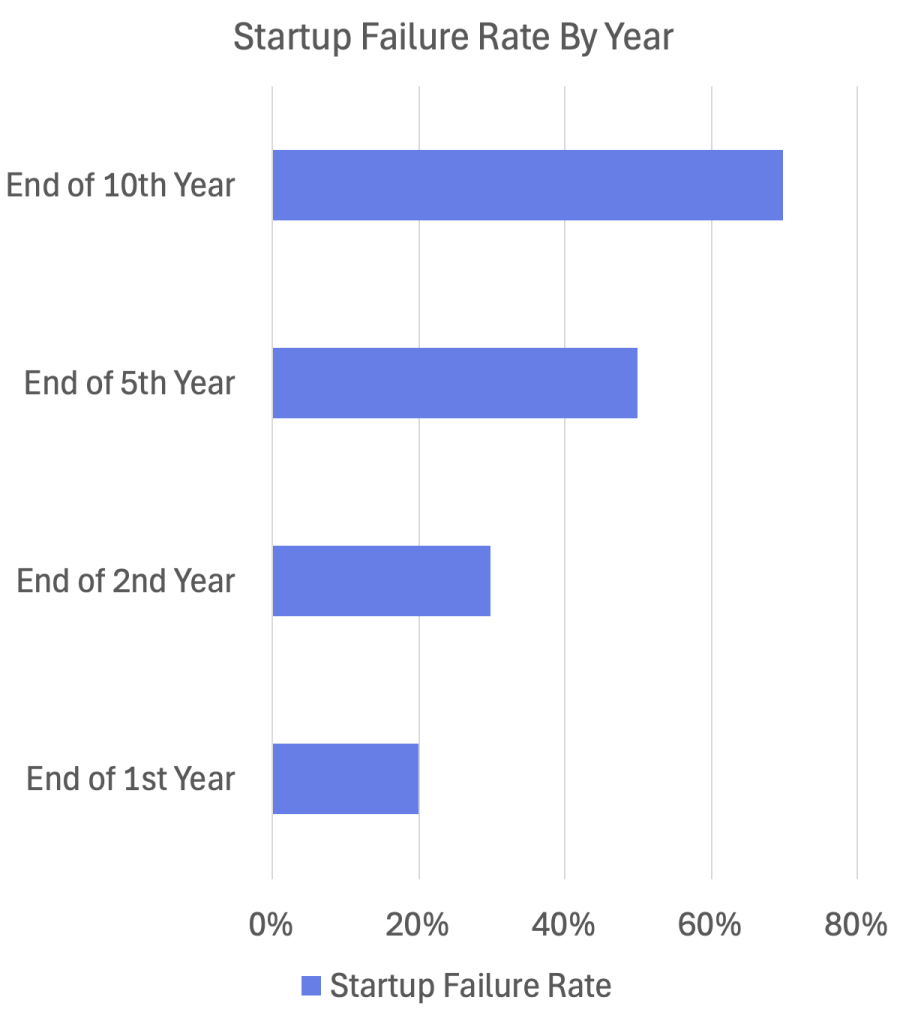
The Failory study also found that startup failure accumulates steadily over time. About 20% of startups close their doors within the first year, often because initial demand or funding falls short.
By the end of the second year, that figure rises to roughly 30%. This reflects how early missteps can snowball if not corrected quickly.
The risk continues to grow as startups try to scale. Around half of all startups won’t make it to the five-year mark, and by year ten, roughly 70% have failed.
The graph below shows the startup failure rates by year.
Conclusion
Understanding startup failure is about more than numbers. It’s about spotting patterns. It’s about knowing where the risks lie. It’s about and planning ahead.
From the challenges of product-market fit and marketing to the differences across industries and the steady rise in failure over time, the data paints a clear picture: building a startup is risky, but knowledge is power.
By learning from these statistics founders can give their ventures the best chance to survive and grow.
